X-ray Tutorial CDK2
Manual Time: 5 min | Parallel processing time: 1.5 h
Goal: You will become familiar with the X-ray analysis workflow on CryoCloud and obtain 4 high resolution structures of CDK2 bound to 4 different ligands in about 1.5h (and <4h total compute time), with just 5 minutes of manual setup required.
Importing the data subsets
If you signed up with a trial, the dataset will already be linked to your account.
If you want to upload your own data, you can find more info here.
Setting up the X-ray workflow
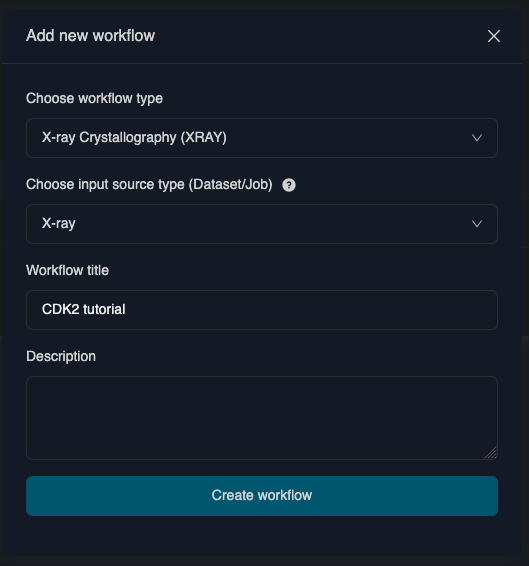
Navigate to the Workflow page on the left, and click +Add new workflow on the top right.
Select X-ray Crystallography as workflow type, and X-ray as input source type. Then click create workflow, which will automatically open the editor for the new workflow.
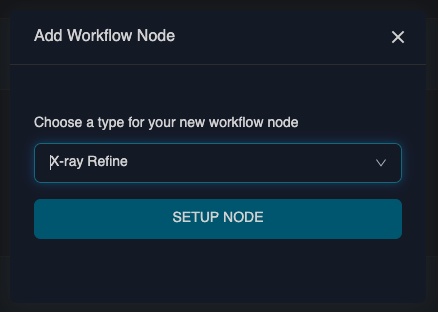
On the bottom right click Add Node, to add a job node to your workflow, and select X-ray Refine as job node type. Click Setup Node.
You can keep the default settings for the job which will use pipedream default values and run the pipedream job in the back.
If you would like to adjust the settings for a job in the future, you can apply changes in that jobs Setup tab. For now, return to the Workflow Editor page by clicking anywhere in the main window.
For this tutorial we only need to specify a single X-ray Refine job which will run pipedream on the 4 data subsets in the next step.
Creating a project from workflow & starting the run
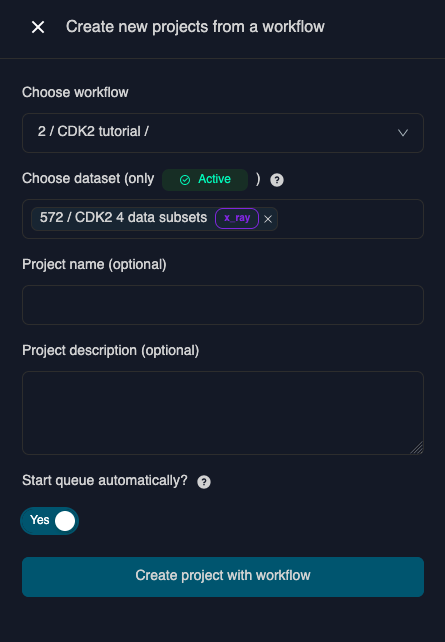
Navigate to the Projects page on the left side of the screen. On the top right select + Start from a Workflow.
Select the workflow that you just created and the CDK2 dataset in your account.
At the bottom, toggle Start queue automatically to Yes.
Then click on Create project with Workflow. This will create the project and submit the jobs for the 4 diffraction datasets of the tutorial. If you click on the created project, you can track the submission and running status of the jobs.
Inspecting the results
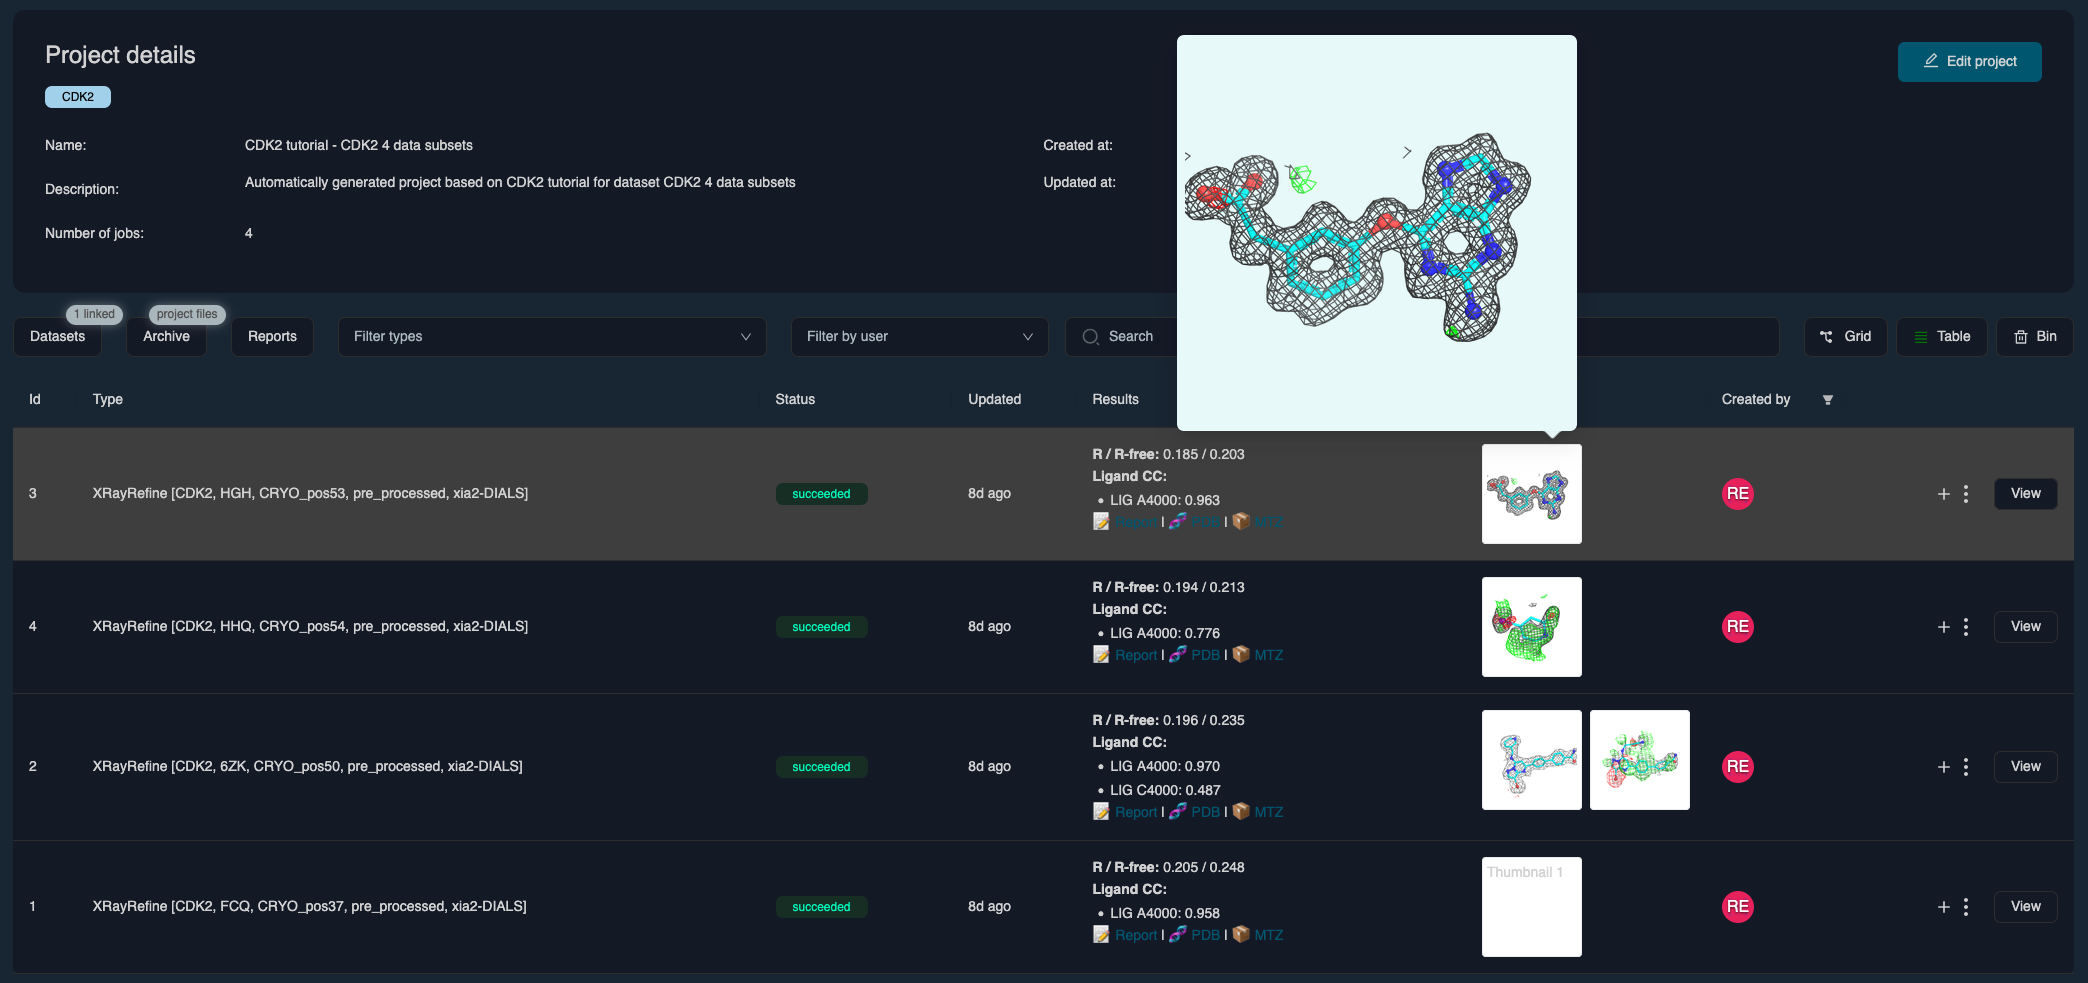
The jobs should finish after approximately 1.5 h. Once they are finished, the project table will display
- the R and Rfree values
- the ligand cross correlation values
- thumbnails of your ligand binding sites showing the ligand model and the local electron density
Here are some useful actions to inspect the results:
- Hover of the thumbnail to enlarge the view
- Click on report to download the Pipedream report as a pdf
- Click on pdb and mtz to download the respective files